2021/22
Singleton

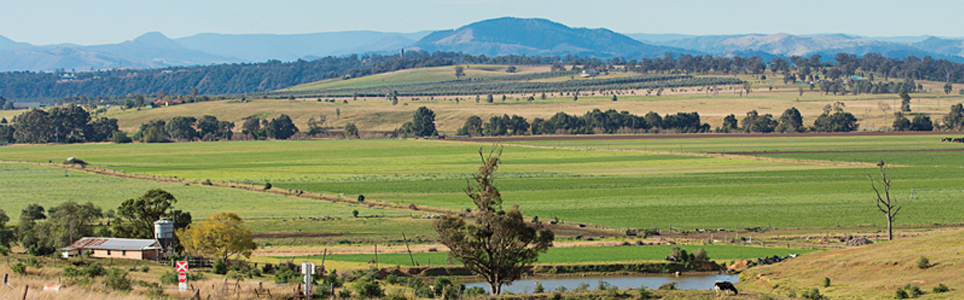
Singleton is located in the Hunter region, surrounded by the natural beauty of Glennies Creek Dam, Lake St Clair, Mt Royal, Yengo and Wollemi National Parks. The area has a variety of landscapes supporting a diverse range of agricultural industries such as beef cattle grazing, dairying, sheep for wool, prime lambs, domestic goats (for meat or wool) and alpacas.

Singleton is also one of Australia’s premier wine producing regions growing a variety of grapes as well as olives. Singleton is home of one of the world’s largest sundials.

Data for this website has been sourced from Council’s financial statements, Council’s annual report and Council’s data returns. The website also refers to data from a number of agencies and entities. Please refer to the data page of this website for links to definitions, information on performance measures, benchmarks, OLG Groups and the data sources that have been used.

Please contact Council if you would like any further details or explanations regarding individual results and any differences between your Council’s performance and that of another council.

Contacting Council

Address:
Queen Street
Singleton NSW 2330
Postal Address:
PO Box 314, Singleton NSW 2330
Phone: 02 6578 7290
Fax: 02 6572 4197

Your Local Government Area

Result
Population (No.) 24,719
Area (Km2) 4,892.70
Council Classification Regional Town/City
OLG Group 4
State Planning Region Hunter
JO Region Hunter

Your Council

Result Group Avg. *
Councillors (No.) 10 9
Population per Councillor (No.) 2,472 4,078
Equivalent Full Time Staff (EFT) (No.) 212 376
2021/22 Revenue ($'000) 78,266,000 140,174,680
2021/22 Expenses ($'000) 67,955,000 108,998,400
Residential Pensioner Rebates (%) 13 17
Population Density (residents per Km2) 5 35
* A NSW council group is determined firstly by whether they are Urban or Rural in nature, and then by population size and density. Please refer to OLG Groups in data tab on website for more information on how individual councils are classified. An OLG group average is then calculated by the average of the same group number eg. All Group 5 Regional Towns/City or all Group 8 Rural.

Your Public Facilities

Result Group Avg.
Public Swimming Pool Complexes (inc rock pools) (No.) 1 1
Public Halls (No.) 5 14
Public Libraries (No.) 1 3
Open Public Space (ha) 245 921
Total Road Length (km) 902 1,354

Demographics of Population

under 20 years
20 - 59 years
60 years and older

Council population (%)

Group population (%)

5.3%

population change last 5 years

Source: ABS, Estimated Resident Population (ERP)

Your Local Population

Latest Outcome Group Avg.
Five Year Population Change (%) 5.3 4
Population aged under 20 years (%) 20.9 18.4
Population aged between 20 and 59 years (%) 65 60.6
Population aged 60 years and older (%) 14.1 21
Aboriginal & Torres Strait Islanders (%) 6 6
Speaks language other than English at home (%) 5 10
Socio-Economic Index Rank (1 low, 128 high) 85 61

Council Population Gender

Aboriginal & Torres
Strait Islander

Language Diversity

Rest of population

Your local population (%)


Your Local Economy

Result Group Avg.
Unemployment Rate (%) 4.2 4.3
Avg Taxable Income ($) 68,600 54,176
Avg Household Size (No.) 2.7 2.4
Value of DA's determined ($'000) 87,366,665 123,266,119
Active Businesses in LGA (No.) 2,059 3,422

Largest Industry Employer

Mining