2023/24
Newcastle

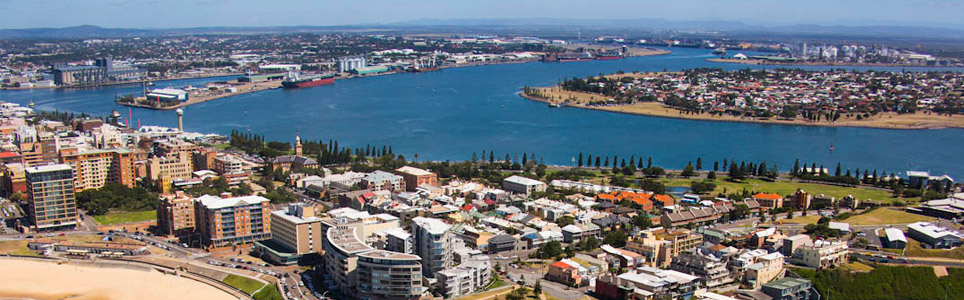
Newcastle City is located in the Hunter region and offers a diverse natural environment, from coastal headlands and beaches to wetlands, mangrove forests, steep ridges and rainforest gullies.

It is known for its coal industry, with the Port of Newcastle, Australia’s largest coal export port by volume and a growing multi-purpose cargo hub. A substantial and growing portion of Newcastle’s economy is now based around the service sectors.

Data for this website has been sourced from Council’s financial statements, Council’s annual report and Council’s data returns. The website also refers to data from a number of agencies and entities. Please refer to the data page of this website for links to definitions, information on performance measures, benchmarks, OLG Groups and the data sources that have been used.

Please contact Council if you would like any further details or explanations regarding individual results and any differences between your Council’s performance and that of another council.

Contacting Council

Address:
12 Stewart Avenue
Newcastle NSW 2300
Postal Address:
PO Box 489, Newcastle NSW 2300
Phone: 02 4974 2000
Fax: 02 4974 2001

Your Local Government Area

Result
Population (No.) 176,860
Area (Km2) 186.7
Council Classification Regional Town/City
OLG Group 5
State Planning Region Hunter
JO Region Hunter

Your Council

Result Group Avg. *
Councillors (No.) 13 11
Population per Councillor (No.) 13605 11191
Equivalent Full Time Staff (EFT) (No.) 1,118 838
2023/24 Revenue ($'000) 439191 342725
2023/24 Expenses ($'000) 388613 263276
Residential Pensioner Rebates (%) 14.25061784 19.30006677
Population Density (residents per Km2) 947 246.70
* A NSW council group is determined firstly by whether they are Urban or Rural in nature, and then by population size and density. Please refer to OLG Groups in data tab on website for more information on how individual councils are classified. An OLG group average is then calculated by the average of the same group number eg. All Group 5 Regional Towns/City or all Group 8 Rural.

Your Public Facilities

Result Group Avg.
Public Swimming Pool Complexes (inc rock pools) (No.) 7 9
Public Halls (No.) 18 24
Public Libraries (No.) 9 5.272727273
Open Public Space (ha) 4310.053459 1660.843042
Total Road Length (km) 888.69 1,317.19

Demographics of Population

under 20 years
20 - 59 years
60 years and older

Council population (%)

Group population (%)

5.3%

population change last 5 years

Source: ABS, Estimated Resident Population (ERP)

Your Local Population

Latest Outcome Group Avg.
Five Year Population Change (%) 5.26843469 5.465935368
Population aged under 20 years (%) 23.3 23.31942337
Population aged between 20 and 59 years (%) 46.5 46.47427912
Population aged 60 years and older (%) 30.2 30.2062975
Aboriginal & Torres Strait Islanders (%) 5 6.524449792
Speaks language other than English at home (%) 10.5 7.018181818
Socio-Economic Index Rank (1 low, 128 high) 98 71

Council Population Gender

Aboriginal & Torres
Strait Islander

Language Diversity

Rest of population

Your local population (%)


Your Local Economy

Result Group Avg.
Unemployment Rate (%) 3.1 3.809090909
Avg Taxable Income ($) 69259 58454.45455
Avg Household Size (No.) 2.4 2.454545455
Value of DA's determined ($'000) 530110 373674
Active Businesses in LGA (No.) 15489 8930.545455

Largest Industry Employer

Health care / Social