2021/22
Moree Plains

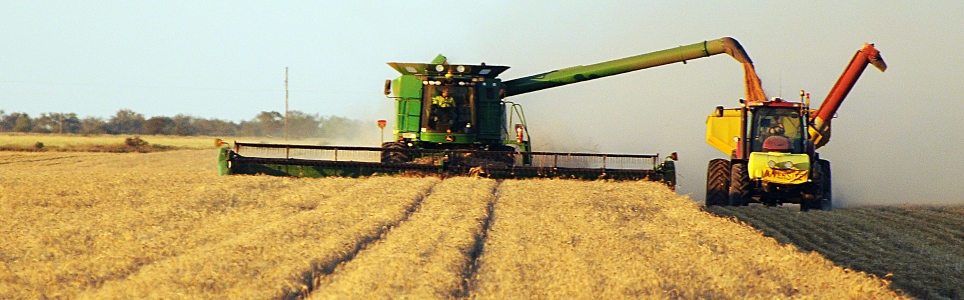
Moree Plains Shire has an area of approximately 17,928.8 km2 with a population of 14,145. Located in the north west slopes, agriculture is a major industry with wheat, barley, sorghum, pulses, cotton, maize, beef, sheep, olives, pecans and canola production.

Moree sits on the south-eastern extremity of the Great Artesian Basin and is also known as the Spa Capital of Australia.

Data for this website has been sourced from Council’s financial statements, Council’s annual report and Council’s data returns. The website also refers to data from a number of agencies and entities. Please refer to the data page of this website for links to definitions, information on performance measures, benchmarks, OLG Groups and the data sources that have been used.

Please contact Council if you would like any further details or explanations regarding individual results and any differences between your Council’s performance and that of another council.

Contacting Council

Address:
Level 2, Max Centre, 30 Heber Street
Moree NSW 2400
Postal Address:
PO Box 420, Moree NSW 2400
Phone: 02 6757 3222
Fax: 02 6752 3934

Your Local Government Area

Result
Population (No.) 12,961
Area (Km2) 17,902.70
Council Classification Large Rural
OLG Group 11
State Planning Region New England North West
JO Region New England

Your Council

Result Group Avg. *
Councillors (No.) 9 9
Population per Councillor (No.) 1,440 1,558
Equivalent Full Time Staff (EFT) (No.) 216 176
2021/22 Revenue ($'000) 76,048,000 62,597,889
2021/22 Expenses ($'000) 70,475,000 50,287,889
Residential Pensioner Rebates (%) 13 21
Population Density (residents per Km2) 1 4
* A NSW council group is determined firstly by whether they are Urban or Rural in nature, and then by population size and density. Please refer to OLG Groups in data tab on website for more information on how individual councils are classified. An OLG group average is then calculated by the average of the same group number eg. All Group 5 Regional Towns/City or all Group 8 Rural.

Your Public Facilities

Result Group Avg.
Public Swimming Pool Complexes (inc rock pools) (No.) 3 3
Public Halls (No.) 8 10
Public Libraries (No.) Not recorded 2
Open Public Space (ha) 238 301
Total Road Length (km) 2,850 1,728

Demographics of Population

under 20 years
20 - 59 years
60 years and older

Council population (%)

Group population (%)

3.6%

population change last 5 years

Source: ABS, Estimated Resident Population (ERP)

Your Local Population

Latest Outcome Group Avg.
Five Year Population Change (%) -3.6 1.7
Population aged under 20 years (%) 21.1 19.4
Population aged between 20 and 59 years (%) 62.8 58.5
Population aged 60 years and older (%) 16.1 22.1
Aboriginal & Torres Strait Islanders (%) 22 7
Speaks language other than English at home (%) 15 11
Socio-Economic Index Rank (1 low, 128 high) 24 44

Council Population Gender

Aboriginal & Torres
Strait Islander

Language Diversity

Rest of population

Your local population (%)


Your Local Economy

Result Group Avg.
Unemployment Rate (%) 2.1 3.5
Avg Taxable Income ($) 67,076 53,624
Avg Household Size (No.) 2.5 2.4
Value of DA's determined ($'000) 0 16,769,104
Active Businesses in LGA (No.) 1,926 1,501

Largest Industry Employer

Agriculture, Forestry and Fishing