2021/22
Hawkesbury

Hawkesbury City Council is located towards the outer north west of the Sydney metropolitan area. It is located about 50 kilometres and approximately one hour’s drive from the central business district.

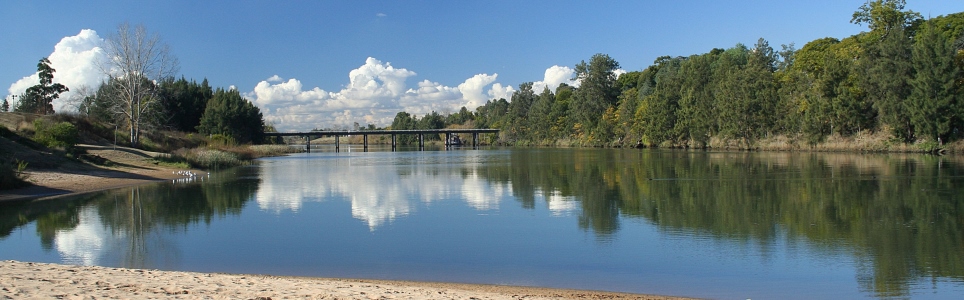
The area takes its name from the majestic Hawkesbury River that flows through it. It is divided by four river valleys and contains fertile flood plains and wetlands, undulating hills, timbered ridges, steep gorges and towering escarpments.

The Hawkesbury is made up of many small townships and localities. The major centres are Windsor, Richmond and North Richmond.

Data for this website has been sourced from Council’s financial statements, Council’s annual report and Council’s data returns. The website also refers to data from a number of agencies and entities. Please refer to the data page of this website for links to definitions, information on performance measures, benchmarks, OLG Groups and the data sources that have been used.

Please contact Council if you would like any further details or explanations regarding individual results and any differences between your Council’s performance and that of another council.

Contacting Council

Address:
366 George Street
Windsor NSW 2756
Postal Address:
PO Box 146, Windsor NSW 2756
Phone: 02 4560 4444
Fax: 02 4587 7740

Your Local Government Area

Result
Population (No.) 67,581
Area (Km2) 2,775.10
Council Classification Metropolitan Fringe
OLG Group 6
State Planning Region Metropolitan Sydney

Your Council

Result Group Avg. *
Councillors (No.) 12 11
Population per Councillor (No.) 5,632 5,826
Equivalent Full Time Staff (EFT) (No.) 342 311
2021/22 Revenue ($'000) 143,736,000 137,482,000
2021/22 Expenses ($'000) 101,677,000 93,884,000
Residential Pensioner Rebates (%) 12 13
Population Density (residents per Km2) 24 23
* A NSW council group is determined firstly by whether they are Urban or Rural in nature, and then by population size and density. Please refer to OLG Groups in data tab on website for more information on how individual councils are classified. An OLG group average is then calculated by the average of the same group number eg. All Group 5 Regional Towns/City or all Group 8 Rural.

Your Public Facilities

Result Group Avg.
Public Swimming Pool Complexes (inc rock pools) (No.) 0 0
Public Halls (No.) 25 25
Public Libraries (No.) 2 2
Open Public Space (ha) 289 317
Total Road Length (km) 1,056 973

Demographics of Population

under 20 years
20 - 59 years
60 years and older

Council population (%)

Group population (%)

1.4%

population change last 5 years

Source: ABS, Estimated Resident Population (ERP)

Your Local Population

Latest Outcome Group Avg.
Five Year Population Change (%) 1.4 3.8
Population aged under 20 years (%) 19.4 20.7
Population aged between 20 and 59 years (%) 64.4 63.8
Population aged 60 years and older (%) 16.2 15.5
Aboriginal & Torres Strait Islanders (%) 4 3
Speaks language other than English at home (%) 6 6
Socio-Economic Index Rank (1 low, 128 high) 99 102

Council Population Gender

Aboriginal & Torres
Strait Islander

Language Diversity

Rest of population

Your local population (%)


Your Local Economy

Result Group Avg.
Unemployment Rate (%) 3.9 3.2
Avg Taxable Income ($) 61,051 61,984
Avg Household Size (No.) 2.8 2.9
Value of DA's determined ($'000) 0 144,805,448
Active Businesses in LGA (No.) 7,118 5,863

Largest Industry Employer

Construction