2021/22
Blue Mountains

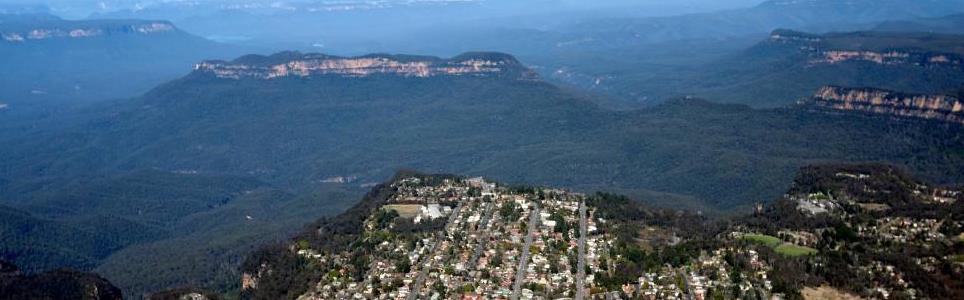
Blue Mountains City comprises 27 character-filled towns and villages spread along mountainous terrain. The Blue Mountains is a nationally and internationally significant World Heritage Area and unique tourist destination, with 70% of the area national park and only 11% available for settlement.

The City of Blue Mountains stretches across the Great Dividing Range and provides a major road and rail link between Sydney and the Central West of NSW.

Data for this website has been sourced from Council’s financial statements, Council’s annual report and Council’s data returns. The website also refers to data from a number of agencies and entities. Please refer to the data page of this website for links to definitions, information on performance measures, benchmarks, OLG Groups and the data sources that have been used.

Please contact Council if you would like any further details or explanations regarding individual results and any differences between your Council’s performance and that of another council.

Contacting Council

Address:
2 Civic Place
Katoomba NSW 2780
Postal Address:
Locked Bag 1005, Katoomba NSW 2780
Phone: 02 4780 5000
Fax: 02 4780 5555

Your Local Government Area

Result
Population (No.) 78,360
Area (Km2) 1,431.10
Council Classification Metropolitan Fringe
OLG Group 7
State Planning Region Metropolitan Sydney

Your Council

Result Group Avg. *
Councillors (No.) 12 11
Population per Councillor (No.) 6,530 12,724
Equivalent Full Time Staff (EFT) (No.) 584 900
2021/22 Revenue ($'000) 139,320,000 319,345,143
2021/22 Expenses ($'000) 123,029,000 225,053,429
Residential Pensioner Rebates (%) 18 11
Population Density (residents per Km2) 54 410
* A NSW council group is determined firstly by whether they are Urban or Rural in nature, and then by population size and density. Please refer to OLG Groups in data tab on website for more information on how individual councils are classified. An OLG group average is then calculated by the average of the same group number eg. All Group 5 Regional Towns/City or all Group 8 Rural.

Your Public Facilities

Result Group Avg.
Public Swimming Pool Complexes (inc rock pools) (No.) 5 5
Public Halls (No.) 15 39
Public Libraries (No.) 6 5
Open Public Space (ha) 6,556 2,179
Total Road Length (km) 749 1,058

Demographics of Population

under 20 years
20 - 59 years
60 years and older

Council population (%)

Group population (%)

0.8%

population change last 5 years

Source: ABS, Estimated Resident Population (ERP)

Your Local Population

Latest Outcome Group Avg.
Five Year Population Change (%) -0.8 10.2
Population aged under 20 years (%) 17.7 20.8
Population aged between 20 and 59 years (%) 60.3 63.3
Population aged 60 years and older (%) 22 15.9
Aboriginal & Torres Strait Islanders (%) 2 2
Speaks language other than English at home (%) 6 12
Socio-Economic Index Rank (1 low, 128 high) 42 90

Council Population Gender

Aboriginal & Torres
Strait Islander

Language Diversity

Rest of population

Your local population (%)


Your Local Economy

Result Group Avg.
Unemployment Rate (%) 2.9 3.9
Avg Taxable Income ($) 60,296 63,058
Avg Household Size (No.) 2.5 2.9
Value of DA's determined ($'000) 162,520,274 1,162,971,683
Active Businesses in LGA (No.) 5,616 14,083

Largest Industry Employer

Education & Training